


ת"א: +972-3-6877128
חיפה: +972-4-8419995


A picture paints a thousand words. There is no time where that is truer than when analysing large volumes of raw data or explaining complex and technical points to stakeholders. Graphic representation of data is an underutilised tool which brings numerous benefits during the claim resolution process.
Within a Business Interruption claim, having an overall perspective of the relevant financial and operational data brings insights that could have been difficult to find or missed entirely. However, data visualisation is not only about identifying specific trends or outliers which require further analysis but also about testing the validity of the entire chain of operational assumptions at a high level. It is surprising how often, at a granular level, a chain of reasoned and slightly sympathetic assumptions culminates into an unachievable ‘but for loss’ scenario. For these reasons, our adjusting team uses data visualisation prepared by our Forensic Accounting function to support the claim resolution process.
Data visualisation helps explain a complex technical point to multiple stakeholders. Summarising paragraphs’ worth of text into a single chart or visualising complex, multifaceted issues in a concise chart helps parties quickly understand the claims issues under discussion and efficiently make informed decisions. Additionally, visualising coverage and claim management assumptions not only increases transparency but aids with the management of stakeholders’ expectations.
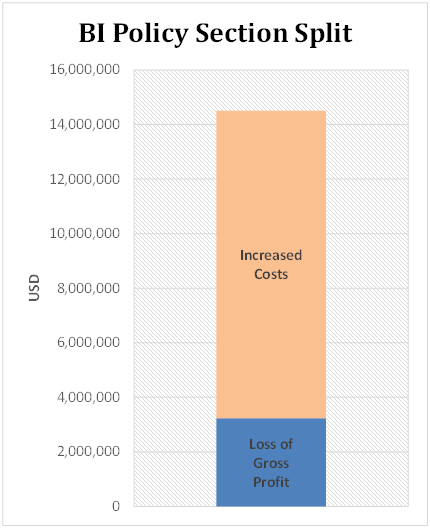
As an example, during the process of analysing a claim, initially we demonstrated the relative proportion of Loss of Profit versus Increased Costs, to illustrate the key policy sections being considered.
Beyond that, our subsequent detailed analysis allowed us to show the claims’ evolving composition over the entire loss period. The following chart illustrates a facility’s incurred losses of gross profit, increased cost of working, extra expenses, savings and cost of temporary repairs.
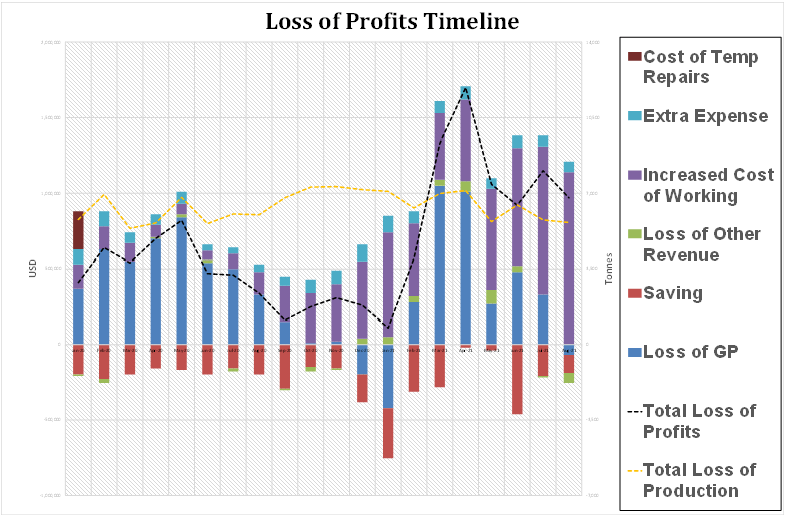
Utilising this chart makes it easy to emphasise to stakeholders that prevailing market forces, dictating the margin generated per MT, have affected incurred losses to a greater extent than the volume of production losses. It can also be easily identified that as the claim has progressed, the increased costs of working have come to become the dominant contributor to the claim. Illustrating these trends not only allows for a deeper understanding of the drivers for the claimed losses but also highlights to stakeholders’ areas that require more detailed analysis.
ZAGUL and GRS are using our forensic accounting capability to support data visualisation on claims in Israel. It is a market where managing stakeholders’ understanding is critical because of reinsurers’ involvement. The effective use of data visualisation can overcome language barriers, reduce potential misunderstandings, and speed claims resolution. These aspects reduce unnecessary claim management friction between the various stakeholders and result in better alignment between local insurers and their reinsurers.

A picture paints a thousand words. There is no time where that is truer than when analysing large volumes of raw data or explaining complex and technical points to stakeholders. Graphic representation of data is an underutilised tool which brings numerous benefits during the claim resolution process.
Within a Business Interruption claim, having an overall perspective of the relevant financial and operational data brings insights that could have been difficult to find or missed entirely. However, data visualisation is not only about identifying specific trends or outliers which require further analysis but also about testing the validity of the entire chain of operational assumptions at a high level. It is surprising how often, at a granular level, a chain of reasoned and slightly sympathetic assumptions culminates into an unachievable ‘but for loss’ scenario. For these reasons, our adjusting team uses data visualisation prepared by our Forensic Accounting function to support the claim resolution process.
Data visualisation helps explain a complex technical point to multiple stakeholders. Summarising paragraphs’ worth of text into a single chart or visualising complex, multifaceted issues in a concise chart helps parties quickly understand the claims issues under discussion and efficiently make informed decisions. Additionally, visualising coverage and claim management assumptions not only increases transparency but aids with the management of stakeholders’ expectations.
As an example, during the process of analysing a claim, initially we demonstrated the relative proportion of Loss of Profit versus Increased Costs, to illustrate the key policy sections being considered.
Beyond that, our subsequent detailed analysis allowed us to show the claims’ evolving composition over the entire loss period. The following chart illustrates a facility’s incurred losses of gross profit, increased cost of working, extra expenses, savings and cost of temporary repairs.
Utilising this chart makes it easy to emphasise to stakeholders that prevailing market forces, dictating the margin generated per MT, have affected incurred losses to a greater extent than the volume of production losses. It can also be easily identified that as the claim has progressed, the increased costs of working have come to become the dominant contributor to the claim. Illustrating these trends not only allows for a deeper understanding of the drivers for the claimed losses but also highlights to stakeholders’ areas that require more detailed analysis.
ZAGUL and GRS are using our forensic accounting capability to support data visualisation on claims in Israel. It is a market where managing stakeholders’ understanding is critical because of reinsurers’ involvement. The effective use of data visualisation can overcome language barriers, reduce potential misunderstandings, and speed claims resolution. These aspects reduce unnecessary claim management friction between the various stakeholders and result in better alignment between local insurers and their reinsurers.
